How Modern Revenue Teams Use Revenue Analytics
Revenue analytics for RevOps teams: the metrics that matter, a 5-stage workflow, and how continuous CRM enrichment improves pipeline, forecasts, and account intel.
Revenue analytics used to show up as a quarterly board-deck ritual. Now it is the day-to-day plumbing for high-performing go-to-market teams. And plenty of B2B orgs are still tripping over the basics: CRM records that go stale fast, pipeline forecasts that swing wide, and buying signals spread across a dozen tools. Forecast reliability depends heavily on the quality and consistency of the CRM data behind it. Incomplete records, outdated opportunity details, and inconsistent processes make reliable forecasting difficult.
This piece lays out the frameworks, metrics, and RevOps workflows teams use when they want revenue insights they can actually run the business on. You will see the core concepts, the metrics that earn a permanent spot on the dashboard, where CRM analytics typically break, and a practical path to implementation. You will also see where automated enrichment (including Bitscale) fits when you are trying to keep the data layer from rotting. Roadmap:
- What Revenue Analytics Actually Means (and how it differs from sales reporting)
- The Metrics Modern RevOps Teams Track across pipeline, forecasting, and account intelligence
- Why CRM Data Quality Breaks Everything and how enrichment solves it
- Building a Revenue Analytics Workflow from data collection to decision-making
- Advanced Considerations for scaling revenue intelligence across the GTM org
- FAQ covering the most common questions from RevOps practitioners
What Revenue Analytics Actually Means
Ignore the vendor gloss and the definition is pretty practical: revenue analytics is the disciplined way you collect, connect, and analyze the data that shapes how your company makes money. That includes pipeline movement, win/loss patterns, account engagement, marketing attribution, expansion signals, and churn risk. Mixpanel's 2025 overview of revenue analytics describes it as tying product, marketing, and growth metrics directly to profitability, not just tracking bookings.
The difference between revenue analytics and plain sales analytics is more than semantics. Sales analytics tends to look backward: rep performance, quota attainment, activity, and deal velocity. Revenue analytics pulls those same numbers into a wider model that includes marketing-sourced pipeline, product usage, renewal health, and expansion revenue. That is what most teams mean when they say B2B revenue analytics: a full-funnel, cross-functional view that leadership can use without playing telephone between departments.
Revenue operations teams build the connective tissue between systems, definitions, and workflows so the GTM organization can operate from shared data instead of competing spreadsheets.
The RevOps Metrics That Drive GTM Decisions
If you try to measure everything, you end up trusting nothing. Strong revenue operations teams typically rally around a small set of metrics that answer three questions: Is the pipeline healthy? Is the forecast credible? Where are deals getting stuck?
| Category | Metric | Why It Matters |
|---|---|---|
| Pipeline Analytics | Pipeline coverage ratio | Shows whether qualified pipeline is sufficient to hit the target based on the team's historical win rate and sales cycle |
| Pipeline Analytics | Stage-to-stage conversion rate | Pinpoints where deals stall and where qualification rules need tightening |
| Pipeline Analytics | Average deal velocity | Tracks time from opportunity creation to close, segmented by deal size and source |
| Sales Forecasting | Weighted pipeline vs. commit | Checks probability-adjusted pipeline against rep-level commits to pressure-test forecast accuracy |
| Sales Forecasting | Forecast variance | Compares forecasted revenue with actual results to reveal recurring overestimation or underestimation |
| Account Intelligence | Engagement score | Rolls up buying signals (website visits, content downloads, intent data) at the account level |
| Account Intelligence | Contact completeness rate | Share of target accounts with verified decision-maker contacts in the CRM |
| GTM Analytics | CAC payback period | Connects marketing spend to the revenue timeline across the funnel |
| GTM Analytics | Net revenue retention | Measures post-sale health by tracking expansion and churn |
| A focused metric set prevents dashboard bloat and keeps teams aligned on outcomes. |
A quick reality check: a lot of these metrics lean on data that does not originate in the CRM. Intent signals, engagement events, verified contact details, technographics - that is the messy stuff. The formulas are rarely the blocker. The blocker is getting clean, complete inputs into those formulas and keeping them that way.
Why CRM Data Quality Breaks Your Pipeline Analytics
Territory planning, quota allocation, and pipeline analysis all become less reliable when the underlying CRM records are incomplete or outdated.
The failure mode is familiar. A rep opens an opportunity and leaves the industry blank. Marketing imports a list with job titles but no phone numbers. A target account swaps tooling, gets acquired, or reorganizes, and the CRM never hears about it. Months later, RevOps pulls a pipeline report and the data tells a story that does not match the field. Forecasts drift. Territory models skew. GTM analytics turns into a rearview mirror when you need a steering wheel.
This is not just a data-entry discipline problem (even if that is part of it). Most CRM setups treat enrichment like a one-time event: load a list, run a cleanup, move on. Meanwhile, contact and company data changes as people move roles, organizations restructure, and technology stacks evolve. Without a defined refresh process, CRM analytics gradually become less dependable.
That is where Bitscale's data enrichment workflows become less of a nice-to-have and more like operational infrastructure. Bitscale supports contact and company enrichment workflows, including work emails, phone numbers, firmographic data, and intent signals, with two-way sync for Salesforce and HubSpot. The practical outcome is straightforward: the CRM stays current enough to support the pipeline analytics and forecasting leadership expects to trust.
Building a Revenue Analytics Workflow That Actually Works
Frameworks only matter if they show up as repeatable work. Here is a five-stage workflow RevOps teams use to get from raw data to revenue intelligence that drives decisions. If your data sources and ownership model are already solid, you can move faster through the first two stages.
Stage 1: Data Collection and Source Mapping
Start with an inventory of every system that touches revenue data. For most B2B teams that means the CRM (Salesforce, HubSpot), marketing automation (Marketo, HubSpot), product analytics (Mixpanel, Amplitude), conversation intelligence (Gong, Chorus), billing (Stripe, Zuora), and one or more intent providers. Then map field ownership: which system is authoritative for which attribute. The goal is not to shove everything into the CRM. It is to establish data ownership so you know where the source of truth lives for every metric you plan to trust.
Stage 2: Continuous Enrichment and Validation
This is the stage most teams shortchange, and it is usually where the whole program either works or quietly fails. Enrichment cannot be a batch job you run before a board meeting. It needs to run continuously to fill gaps, correct drift, and pull in new signals as accounts change. Bitscale's waterfall enrichment approach is a good example: instead of betting on a single provider (and accepting its coverage holes), it cascades through multiple sources to improve match rates for emails, phone numbers, and firmographic attributes. That kind of coverage directly moves the contact completeness rate metric in the right direction.
Enrichment without validation is just more fields to mistrust. Automated checks for email deliverability, phone connectivity, and company status help keep your team from running plays on stale or incorrect records.
Stage 3: Consolidation and Modeling
After the data is clean and consistently enriched, you need a unified model. In a smaller org, that can be a well-structured CRM with the right custom objects and calculated fields. In larger teams, it often means a warehouse (Snowflake, BigQuery) plus a semantic layer so definitions do not drift between teams. The output that matters most is boring but essential: one definition per metric. If marketing and sales calculate pipeline differently, your analytics will generate arguments, not answers.
Stage 4: Analysis and Visualization
Dashboards are the interface, not the analysis. The real work starts when someone asks a question the dashboard was not designed to answer: "Why did our enterprise win rate drop eight points in Q2?" or "Which accounts that spiked on intent last quarter actually converted?" Build in Tableau, Looker, or native CRM dashboards around the five questions you hear every week, and keep room for ad hoc exploration when the business changes. Shared dashboards give sales, marketing, finance, and customer success a common view of pipeline performance, provided that the underlying definitions and data are consistent.
Stage 5: Action and Feedback Loop
If insights do not change behavior, you have reporting - not revenue analytics. Tie every insight to a workflow: re-prioritize accounts, adjust territories, trigger an outbound sequence, or escalate an at-risk renewal. Then close the loop. When a rep marks a deal as lost, capture the reason in a structured field so it feeds back into your model instead of disappearing into call notes. The value comes from connecting insight to execution and feeding the outcome back into the analytics model.
Buying Signals and Account Intelligence in Practice
Buying signals get talked about constantly. Turning them into something a rep can act on is rarer. A buying signal is any data point that raises the odds an account is ready to buy: a job posting for a role your product supports, a sudden spike in website activity, a technology adoption that creates integration needs, or a funding round that unlocks budget. The operational headache is that each signal lives in a different system, with a different format, and usually a different owner.
Bitscale tackles that gap with AI agent research that scans public sources and turns them into usable account intelligence: leadership changes, technology shifts, expansion indicators, and competitive displacement signals. That context lands in CRM records so reps have something concrete before they reach out. When outreach is tied to a real trigger instead of a generic persona pitch, teams typically see the difference show up in reply rates and pipeline creation.
If you are comparing options here (Clay, Apollo.io, Cognism, Lusha, and others all play in this neighborhood), the evaluation criteria are usually less about flashy features and more about fundamentals: coverage, enrichment depth, CRM sync reliability, and whether workflows are ready-made or require heavy custom build. Bitscale leans into the workflow side by pairing sales intelligence with pre-built enrichment and native CRM sync, which reduces the implementation drag that often slows revenue intelligence projects to a crawl.
Advanced Considerations: Scaling Revenue Analytics Across the GTM Org
Once the workflow is in place, three issues tend to surface as teams scale B2B revenue analytics across the broader GTM org.
Forecast committee alignment. Forecasting falls apart when leaders apply different judgment to the same underlying data. The fix is rarely more data. It is agreeing on a forecasting methodology (category-based, stage-weighted, or AI-assisted) and using it consistently across segments. Your revenue analytics platform should reinforce that methodology, not just render a set of numbers.
Multi-product and multi-segment complexity. A single pipeline view works when you sell one product to one buyer. Add a second product line or move upmarket and you need segmented pipeline analytics with different conversion benchmarks. Aggregates can look healthy while one segment is quietly collapsing or a new product launch is underperforming.
Data governance at scale. Who can edit opportunity amounts? What counts as a "qualified" lead? These questions sound bureaucratic until someone inflates deal size to hit a coverage threshold and the forecast snaps. Put field-level permissions, validation rules, and audit trails in early. Retrofitting governance into a mature CRM is slow and painful.
A pattern shows up across the teams that do this well: they treat enrichment and data quality as infrastructure, not a quarterly cleanup project. They put tools like Bitscale to work continuously, syncing enriched data back to the CRM so every downstream report, forecast, and workflow runs on current information. You can review Bitscale's case studies to see how teams have implemented that model across different GTM motions.
Key Takeaways and Next Steps
Revenue analytics is not a prettier dashboard. It is how a GTM org makes decisions with the same set of numbers: clean inputs, consistent definitions, and workflows that actually close the loop. The teams that get it right tend to do three things well: they run enrichment continuously, they align on metric definitions before they build dashboards, and they connect insights to specific actions in the field.
- Audit CRM completeness and freshness across priority accounts. If missing or outdated fields are preventing accurate segmentation, routing, or reporting, address those gaps before expanding the analytics stack.
- Align on five to seven core RevOps metrics across sales, marketing, and customer success before adding more dashboards.
- Implement waterfall enrichment to eliminate single-provider coverage gaps and keep records current.
- Build a feedback loop that captures win/loss reasons, deal slip causes, and forecast misses in structured fields.
- Evaluate the complete revenue data stack against the five-stage workflow: does it support reliable collection, enrichment, modeling, analysis, and activation?
If your revenue analytics are only as good as the data feeding them (they are), start with the foundation. Explore Bitscale's enrichment and sales intelligence platform to see how automated enrichment, buying-signal consolidation, and CRM sync can provide the reliable data layer your analytics depends on.
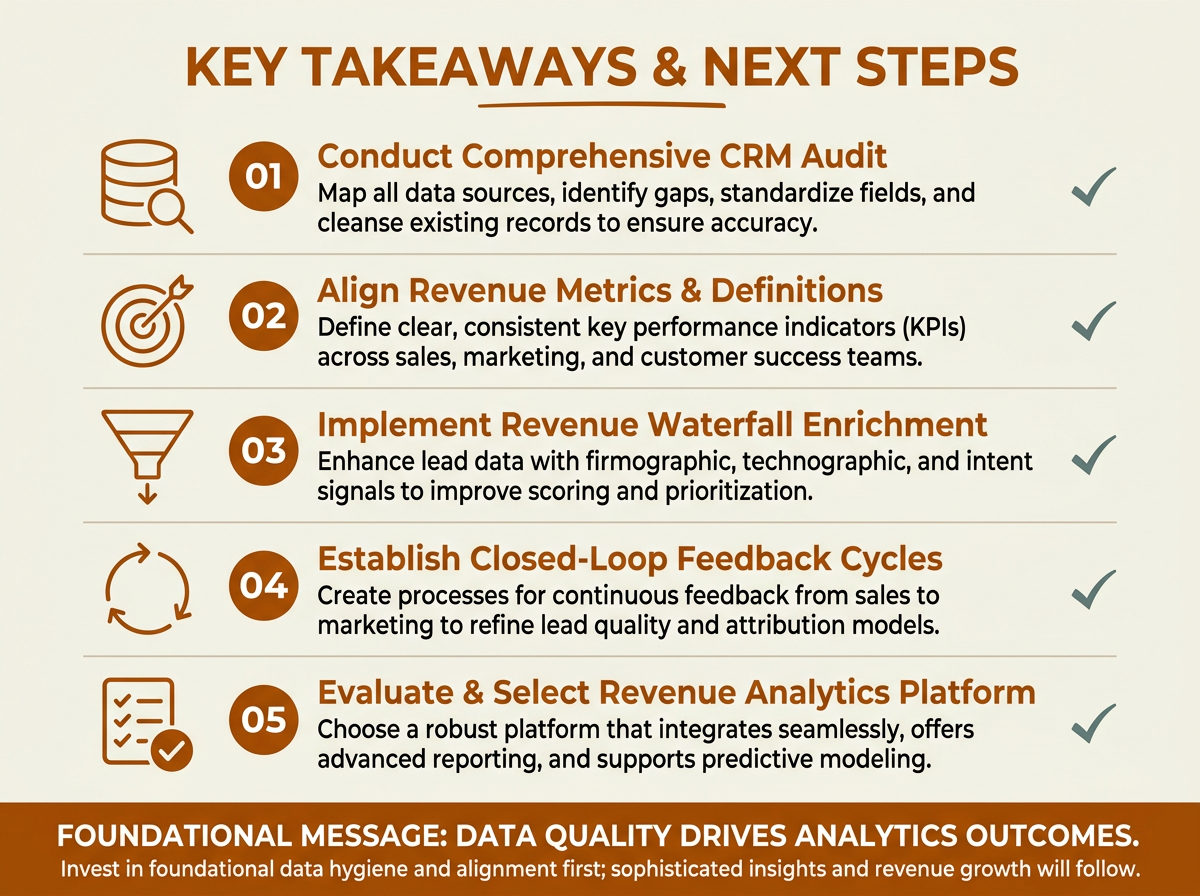
Five actionable steps to build a reliable revenue analytics foundation, starting with CRM data quality.
Frequently Asked Questions
What is the difference between revenue analytics and sales analytics?
Sales analytics is usually scoped to sales performance: quota attainment, rep activity, and deal-level outcomes. Revenue analytics widens the lens by integrating marketing, sales, customer success, and product data to show how revenue is created, retained, and expanded across the full funnel. In most B2B orgs, that cross-functional view sits with revenue operations rather than any single department.
How do I improve sales forecasting accuracy?
Start with data quality. If the CRM is missing core fields or running on stale account and contact records, the forecast will be wrong no matter how polished the dashboard looks. Put continuous enrichment in place, standardize a forecasting methodology across segments, and lean on stage-to-stage conversion rates instead of rep intuition as the primary input. Improving forecast reliability gives leaders greater confidence when making staffing, spending, and prioritization decisions
What role does data enrichment play in revenue analytics?
Enrichment closes the gaps that break analytics: missing emails, outdated titles, incomplete firmographics, and blind spots around technographics and buying signals. Without it, pipeline analytics and account intelligence are built on partial information. Tools like Bitscale use waterfall enrichment to cascade across multiple data providers, improving coverage and accuracy compared with relying on a single source.
How often should CRM data be enriched?
Continuously. Contact and company data changes continuously as people move roles, organizations restructure, and technology stacks evolve. Quarterly or annual batch enrichment leaves long stretches where the CRM is out of date. Strong RevOps teams run automated enrichment on record creation, on a schedule, and on key events like deal stage changes so the data stays usable.
What should I look for in a revenue analytics platform?
Look for reporting, forecasting, segmentation, governance, and integration capabilities that match how your team operates. Then assess whether the platform can work with an enrichment layer such as Bitscale, which supplies contact and company data, buying signals, and two-way CRM sync upstream of the analytics process.